Quick Menu
Food Processing Monitoring
Raman Applications in Food-Processing
Raman Spectroscopy can be used to determine identity and quantity of substances within food stuffs. We have provided some examples of the applications we’ve been able to develop for the food processing industry
Edible Oils
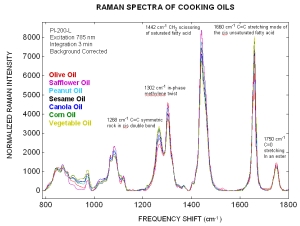
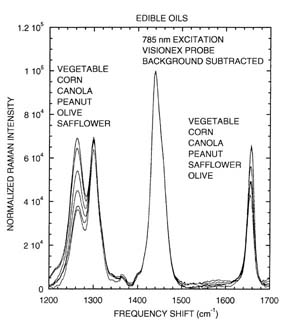
Safflower, Peanut, Olive, Corn, Canola, Vegetable Raman spectroscopy can rapidly determine the type of oil, purity of the oil, and measure the fat content with in the oil. The figure to the right displays the observed Raman spectra for different edible oils; olive, safflower, peanut, sesame, canola, corn, and vegetable. The major peaks used for authentication and analysis of fat content are identified in the figure.
Fat Content Comparison The correlation of known saturated fat content from different edible oil samples and Raman analysis is displayed in the figure to the right. The standard error of prediction for the Raman analysis was 0.40%.
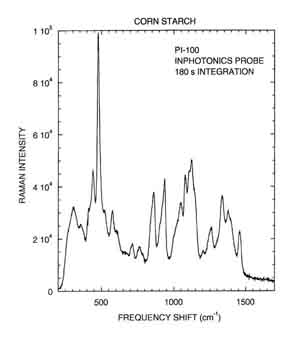
Fat / Cornstarch
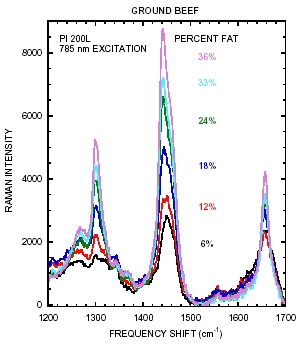
The Raman spectrum of a ground beef sample has two distinct bands that can be used to determine the amount of fat content within the sample. The two bands are located at 1300 cm-1 and 1447 cm-1. To demonstrate that the intensity of these two different bands correlate to the sample’s fat content, we obtained Raman spectra from different ground beef samples containing increasing amounts of fat. This study was conducted by initially obtaining the Raman spectrum from a sample containing 6 wt % fat and successive samples were created by hand blending increasing amounts of pure fat into the initial ground beef mixture. During the Raman analysis the samples were located at the focus of the Raman probe, and they were also spun on a rotary stage during the two minute integration to avoid investigating discrete sample locations. The figure to the right displays the observed Raman spectra for the different beef samples analyzed.

