Quick Menu
Raman vs. IR
Raman Spectroscopy Example
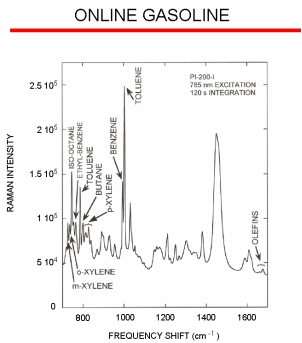
The figure to the right displays a typical online Raman spectrum of a gasoline stream with the different peaks from many of the major chemical components indicated. The peak frequency shift (i.e., the location along the X-axis) yields the sample composition, and the peak intensity yields the concentration of that particular component. A key advantage with the Raman effect is that it is a linear process. Therefore, a sample’s Raman band for an individual molecule will be twice as intense when the sample contains twice as many of those molecules. Using the online spectra, chemometric data analysis models can be created to determine the different sample parameters. A model is created by correlating the online spectral response to laboratory data, and generally this approach requires around 100 samples to create a robust model.
Raman vs. IR
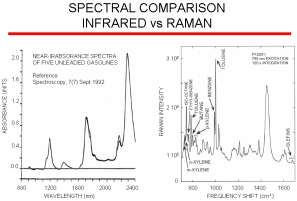
The figure on the right compares NIR gasoline data and data obtained with our Raman analyzer. NIR has very broad bands arising from overtones and harmonics that contain only subtle differences between different gasoline blends whereas Raman spectroscopy provides excellent spectral resolution of fundamental vibrations allowing for minimum component overlap and maximum component specificity. Raman has the advantage over infrared in that there is no interference from water so the probe can be directly inserted into a process stream. Infrared requires a sample conditioner. A single Raman system can be multiplexed up to 18 channels/streams. Because of the poor resolution of NIR analyzers, it is difficult to transfer chemometric models between instruments. However, models transfer easily with our Raman instruments and so additional models for new blends or components can be developed on our laboratory instrument and then be directly loaded onto our on-line process Raman analyzer.


