Quick Menu
Distillate Solutions
Here are some examples of some of the solutions we have provided for distillate measurements.
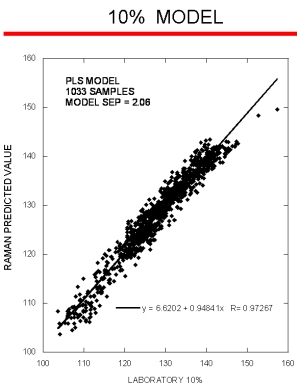
Typical online PLS analysis of the 10% distillation temperature (10%). The plot shows Raman predicted values vs. the measured laboratory values. The standard error of prediction for the PLS model with outliers removed was 2.06.
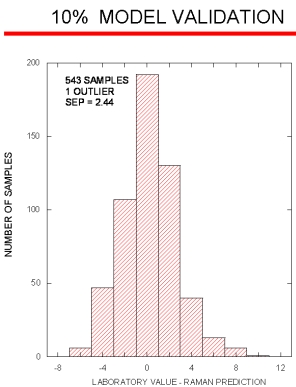
A histogram of the distribution of differences between the laboratory and Raman predictions for an independent validation set of spectra that are not included in the PLS model. The standard error of prediction for the validation set (543 samples) with 1 outliers removed was 2.44.
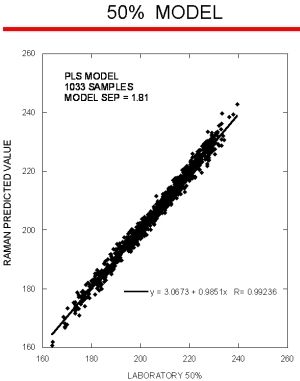
Typical online PLS analysis of the 50% distillation temperature (50%). The plot shows Raman predicted values vs. the measured laboratory values. The standard error of prediction for the PLS model with outliers removed was 1.81.
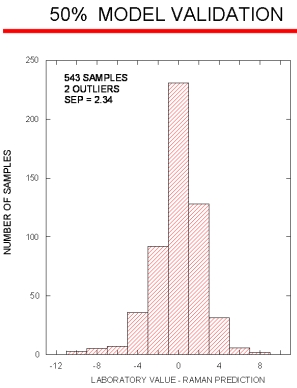
A histogram of the distribution of differences between the laboratory and Raman predictions for an independent validation set of spectra that are not included in the PLS model. The standard error of prediction for the validation set (543 samples) with 2 outliers removed was 2.34.
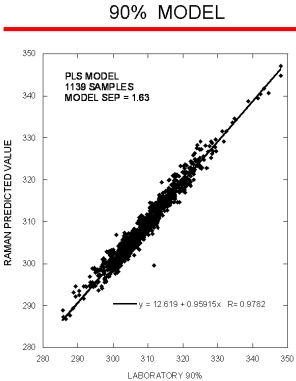
Typical online PLS analysis of the 90% distillation temperature (90%). The plot shows Raman predicted values vs. the measured laboratory values. The standard error of prediction for the PLS model with outliers removed was 1.63.
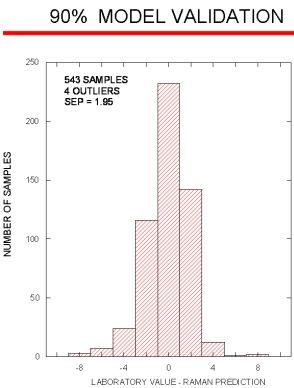
A histogram of the distribution of differences between the laboratory and Raman predictions for an independent validation set of spectra that are not included in the PLS model. The standard error of prediction for the validation set (543 samples) with 4 outliers removed was 1.95.
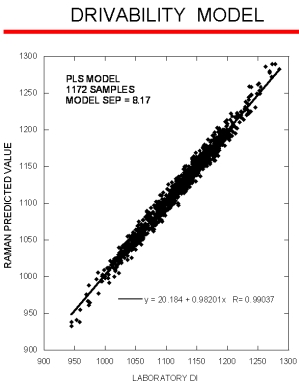
Typical online PLS analysis of the drivability index (DI). The plot shows Raman predicted values vs. the measured laboratory values. The standard error of prediction for the PLS model with outliers removed was 8.17.
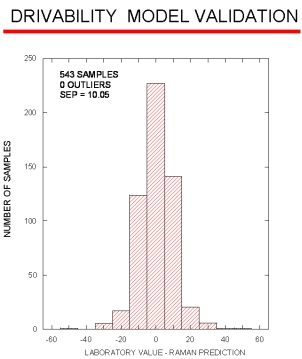
A histogram of the distribution of differences between the laboratory and Raman predictions for an independent validation set of spectra that are not included in the PLS model. The standard error of prediction for the validation set (543 samples) with NO outliers removed was 10.05.
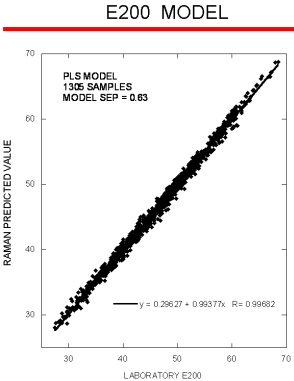
Typical online PLS analysis of the distillation fraction at 200F (E200). The plot shows Raman predicted values vs. the measured laboratory values. The standard error of prediction for the PLS model with outliers removed was 0.63.
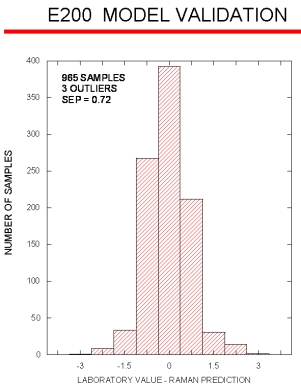
A histogram of the distribution of differences between the laboratory and Raman predictions for an independent validation set of spectra that are not included in the PLS model. The standard error of prediction for the validation set (965 samples) with 3 outliers removed was 0.72.
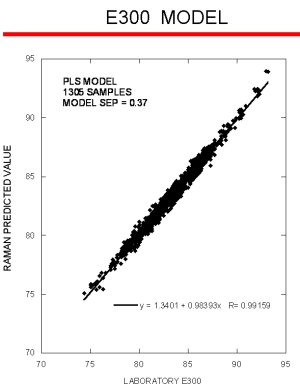
Typical online PLS analysis of the distillation fraction at 300F (E300). The plot shows Raman predicted values vs. the measured laboratory values. The standard error of prediction for the PLS model with outliers removed was 0.37.
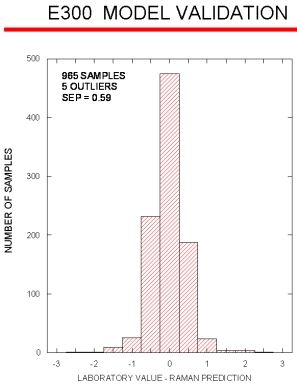
A histogram of the distribution of differences between the laboratory and Raman predictions for an independent validation set of spectra that are not included in the PLS model. The standard error of prediction for the validation set (965 samples) with 5 outliers removed was 0.59.
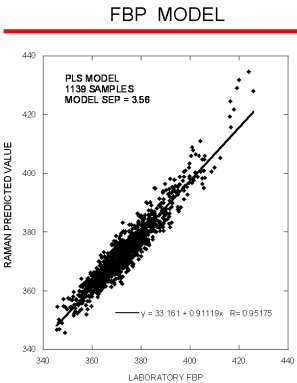
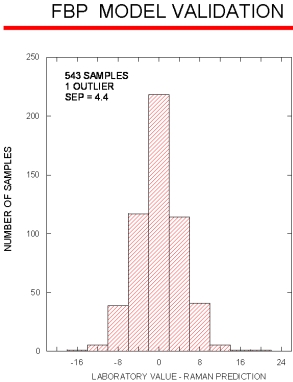
Typical online PLS analysis of the final boiling point (FBP). The plot shows Raman predicted values vs. the measured laboratory values. The standard error of prediction for the PLS model with outliers removed was 3.56.

