Quick Menu
Diesel Fuels Solutions
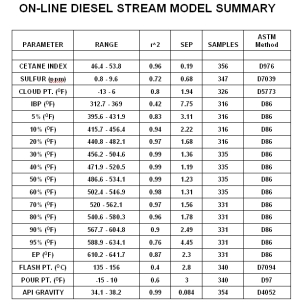
Typical online results for a diesel stream. The low standard error of prediction (SEP) between the laboratory minus the Raman predicted values show that our Raman analyzer can reliably model critical parameters. ASTM methods used for the laboratory analysis are displayed in the far right column.
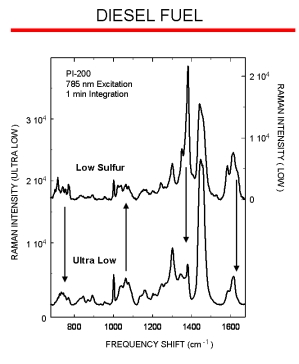
Spectra of a low sulfur and an ultra low diesel fuel. The down arrows in the figure indicate several distinct low sulfur spectral bands that are not apparent in the ultra low spectrum.
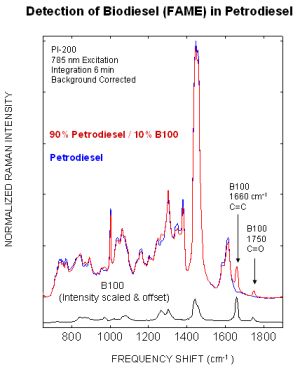
Biodiesel is a renewable diesel fuel that is also known as FAME (fatty acid methyl ester) in the European Community. Spectra of a diesel fuel and the same fuel containing 10% biodiesel (FAME) are displayed to the right. An intensity scaled biodiesel spectrum is also displayed for reference. The two dominant biodiesel peaks at 1660 cm-1 (C=C) and 1750 cm-1 (C=O) are easily detected in a petroleum diesel fuel spectrum, and can be used to determine the amount of biodiesel (FAME) in diesel fuel.
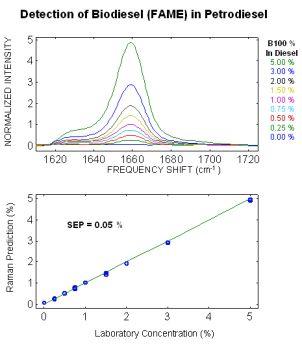
The spectral responses from trace concentrations of biodiesel (FAME) in regular diesel are displayed to the right (upper figure). The observed spectral responses were initially background corrected. A standard PI-200-L spectrograph was used for this study. Comparisons between the actual and predicted biodiesel concentrations in regular diesel are displayed in the lower figure to the right. The Raman predictions were determined from the 1660 cm-1 (C=C) peak heights, and the standard deviation from the (actual – predicted) concentrations was 0.05 vol%. Lower detection limits, down to the 500 ppm range, could be easily obtained by using our high performance CCD, increasing laser power, or increasing the sample integration time.


